
Can we know which of the banks in Barcelona has the best coverage? In this post we will try to answer this question using geographic data from OpenStreetMaps and QGIS.
First of all, let’s define what we will understand by best coverage: a bank has better coverage while the lower is the average distance from a random point in the city to the nearest 3 branches.
This definition requires from us to have three components: a list of random points in the city of Barcelona, a list with the locations of the branches of the different banks and a program to calculate the closest branch to each of these random points.
QGIS and OpenStreetMap to obtain geographic data
QGIS is a free software tool for geographic data processing that allows us to connect to different sources and perform a wide variety of analysis.
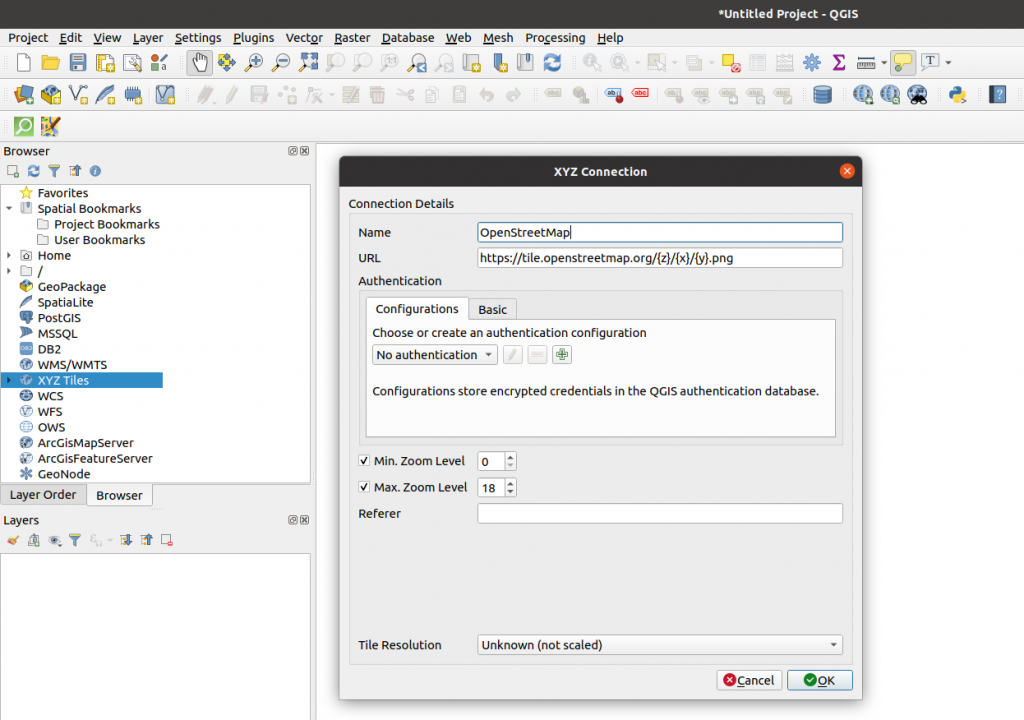
The geographic data from the city of Barcelona can be obtained from OpenStreetMap. To do this, first we create an XYZ connection from the browser menu by placing the following address as the URL: https://tile.openstreetmap.org/{z}/{x}/{y}.png
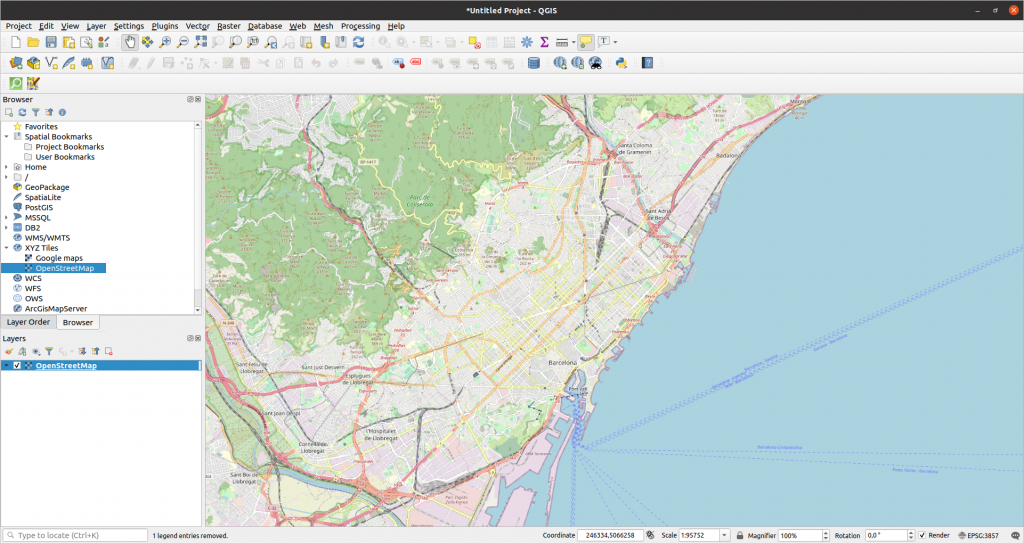
Once the connection is created, we add the layer to the project and we will get the OpenStreetMap map in the window:
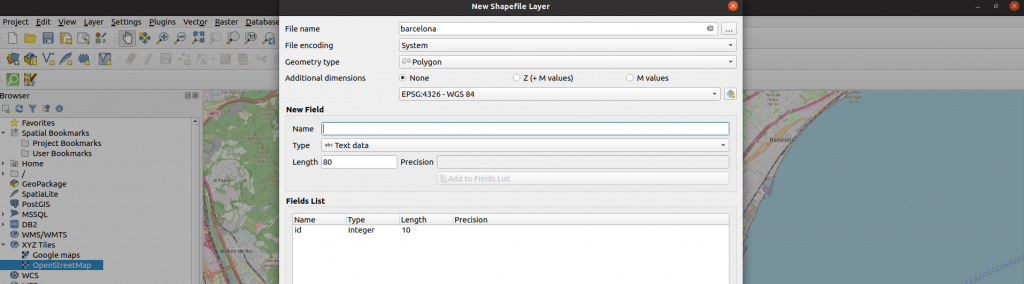
To define Barcelona in this map, we can add a polygonal layer to the project where we manually define what we want Barcelona to be. To do this go to the menu Layer > Create Layer > New Shapefile Layer:
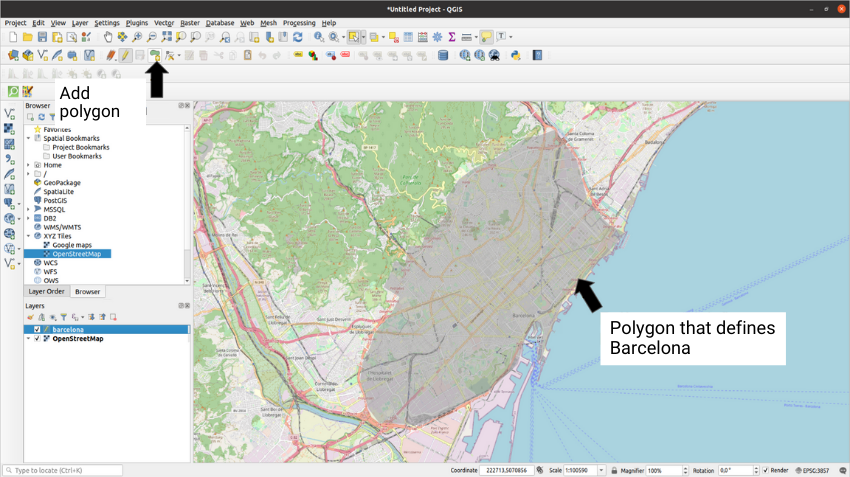
Once the layer is created, if we select it with right click and then click on Toggle Editing we will see the option to add a polygon which we can use to draw on the layer the area we want to delimit as Barcelona:
This polygon will be used both to generate random points in its extension and to make queries to OpenStreetMap. We can make queries to the OpenStreetMap database through QuickOSM, a QGIS plugin to interact with this page. Once QuickOSM is installed, clicking the magnifying glass with green background that appears in the toolbar, we can make a query and turn it into an extra layer in our project:
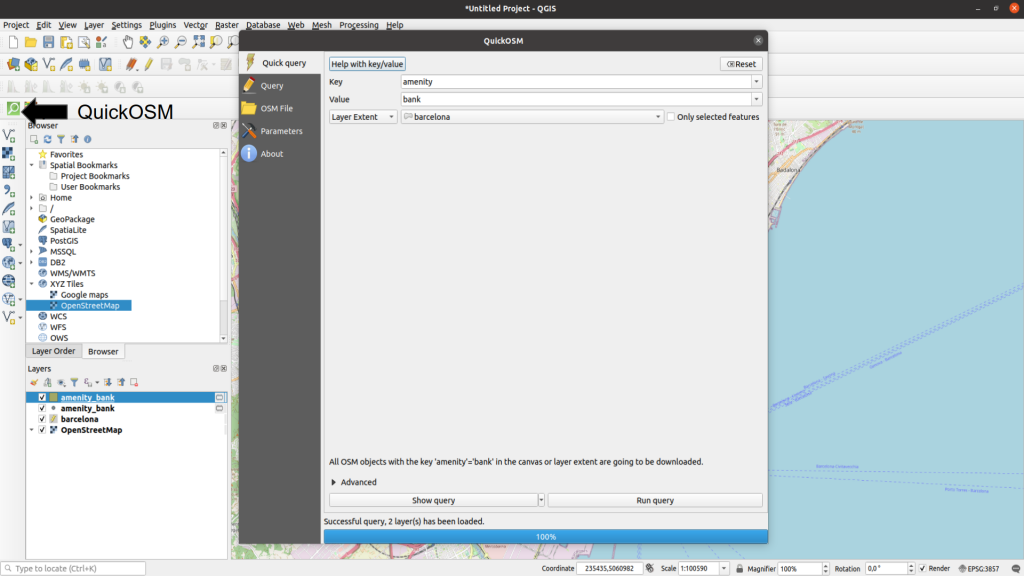
QuickOSM can generate 2 layers, one for observations that are stored as polygons and one with observations stored as points.
To use the polygon layer we can extract the centroid of each polygon and join it to the points layer. This can be achieved through the QGIS centroids tool located in Vector > Geometry Tools > Centroids, which will generate a new layer with the centroids and associated features.
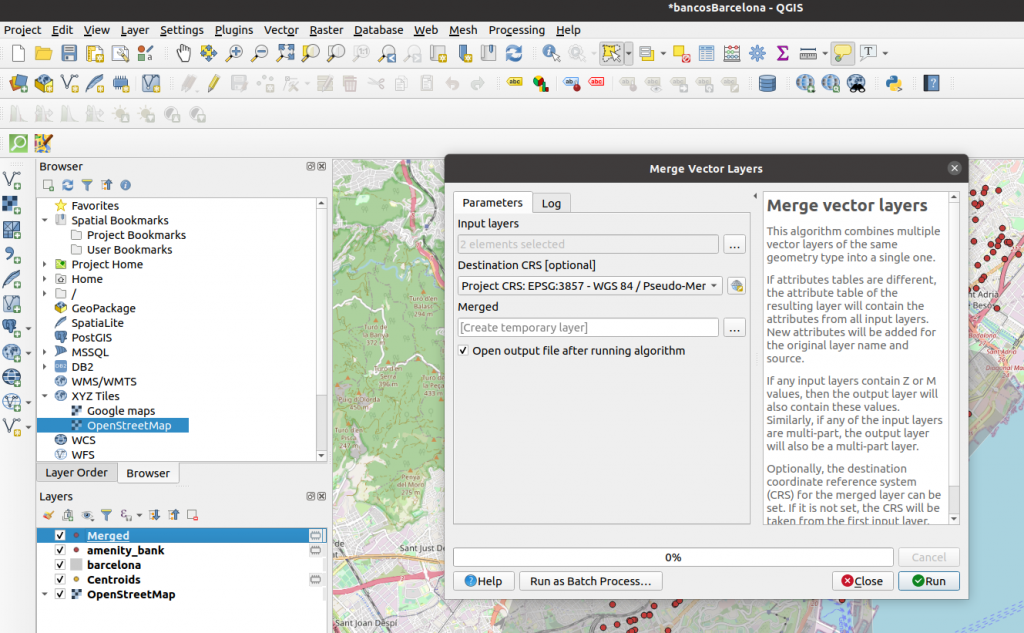
Finally, we must join the points layer and the centroids layer. For this, we use Vector > Data Management Tools > Merge Vector Layers and provide the two layers that we want to join. The algorithm will perform the merge and create a new layer called Merged:
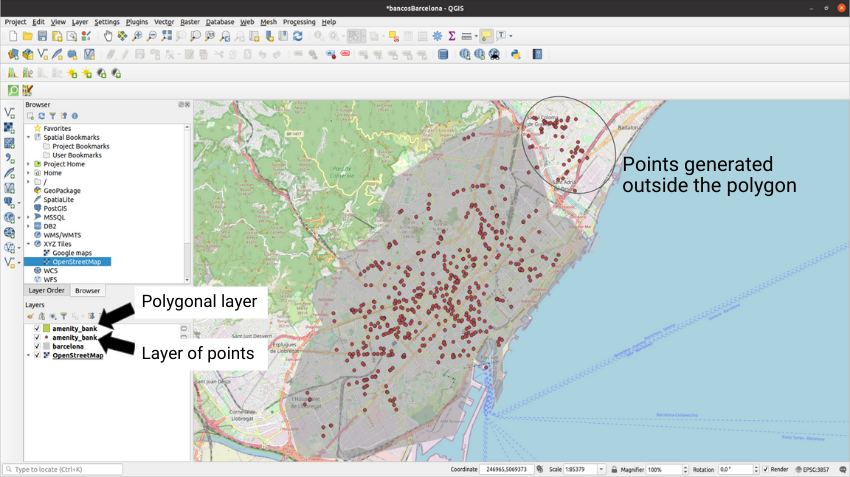
Sometimes, QuickOSM can generate points outside the area that we have delimited previously with our hand-drawn polygon. To deal with these points just use the selection tool and delete the selected points. We must remember that, in order to use the selection tool, you must have a layer selected in the layers window and have the layer editing enabled:
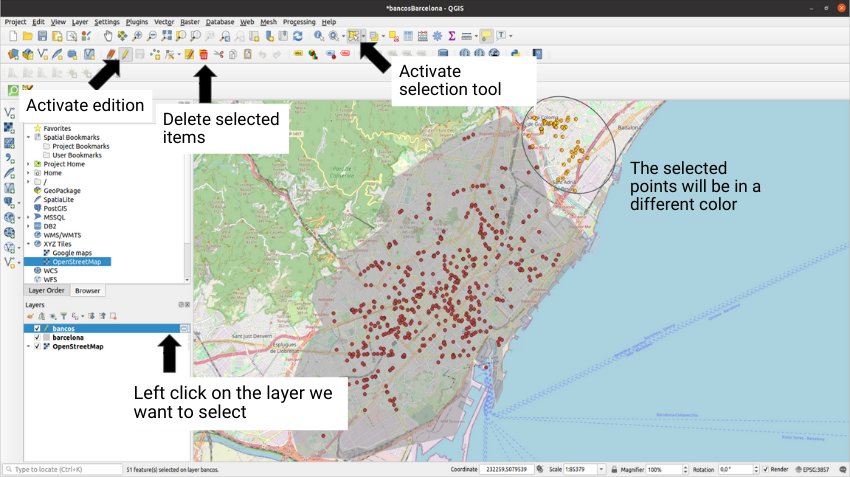
As we can see, now there will be a layer whose points will coincide on the map with the banks:
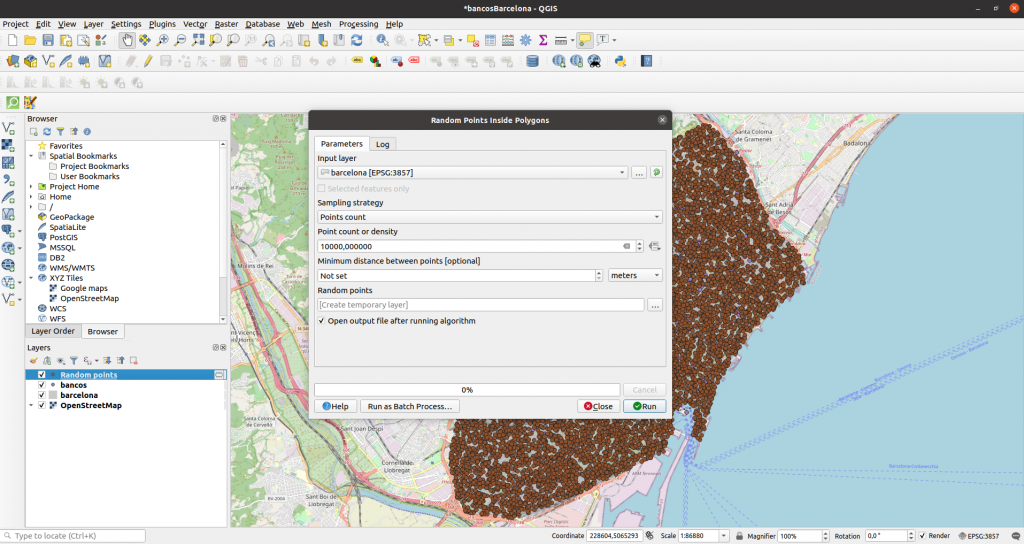
Random points may be generated in the menu Vector > Research Tools > Random Points Inside Polygon:
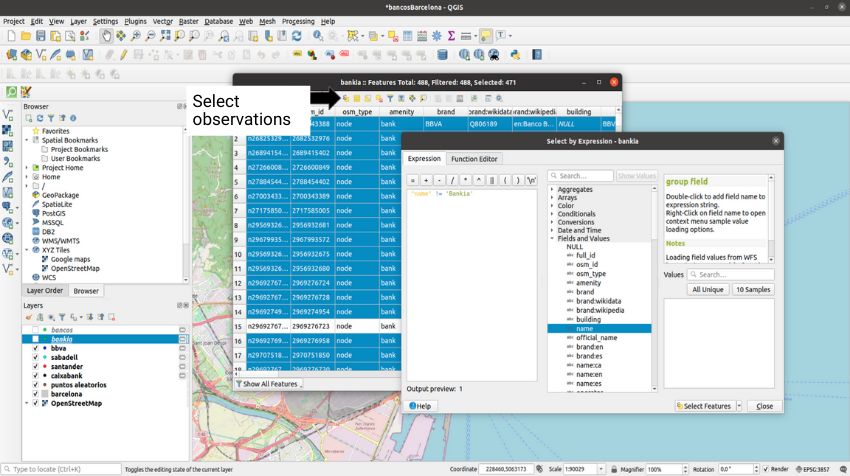
Now we must create a layer with the agencies of each bank separately. We will focus on 4 banks: BBVA, Caixabank, Sabadell and Santander. To take the points of each of these banks, we will duplicate 5 times the layer of banks and rename them with the points of the bank that we will keep in each one. Next we right click on the layer and then click on Open Attribute Table; we select the observations that are not of the bank that we want in the layer and we delete them.
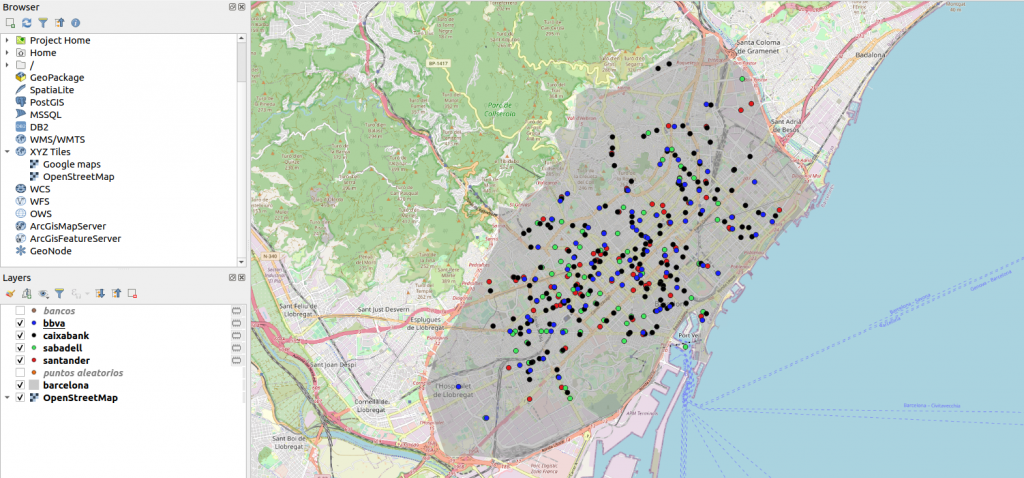
If we modify the colors we should have a map like this:
Calculating the distance to find the nearest bank
With our random points we can already calculate the distance from each of those points to the nearest agency of each bank. For this, we are going to make a distance matrix that compares each of our bank layers to the random points. This can be done by going to Vector > Analysis Tools > Distance Matrix:
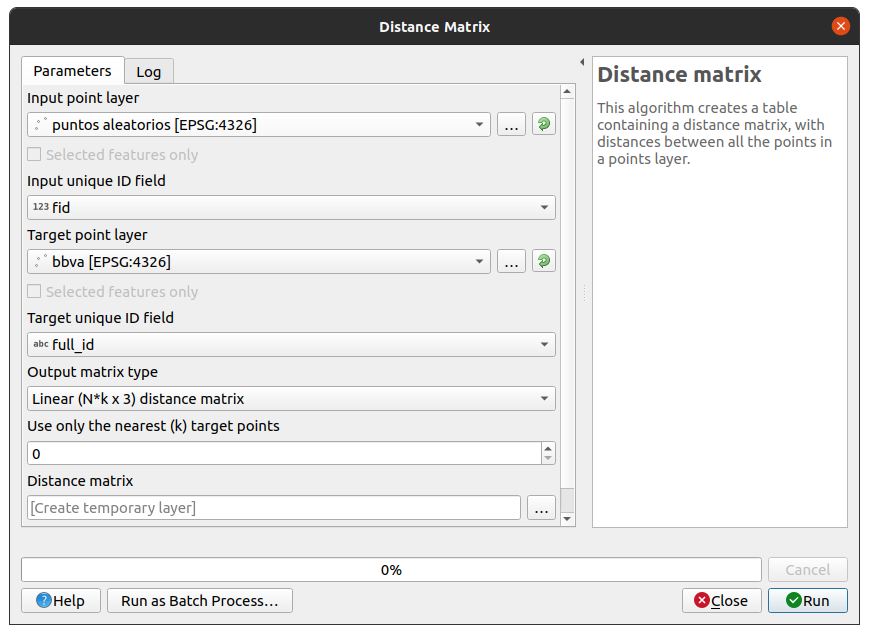
Once we have clicked “Run”, QGIS will create a layer with the same number of points as there are in our random points layer and with measures such as the average distance to the point from the 3 nearest neighbors and their standard deviation:
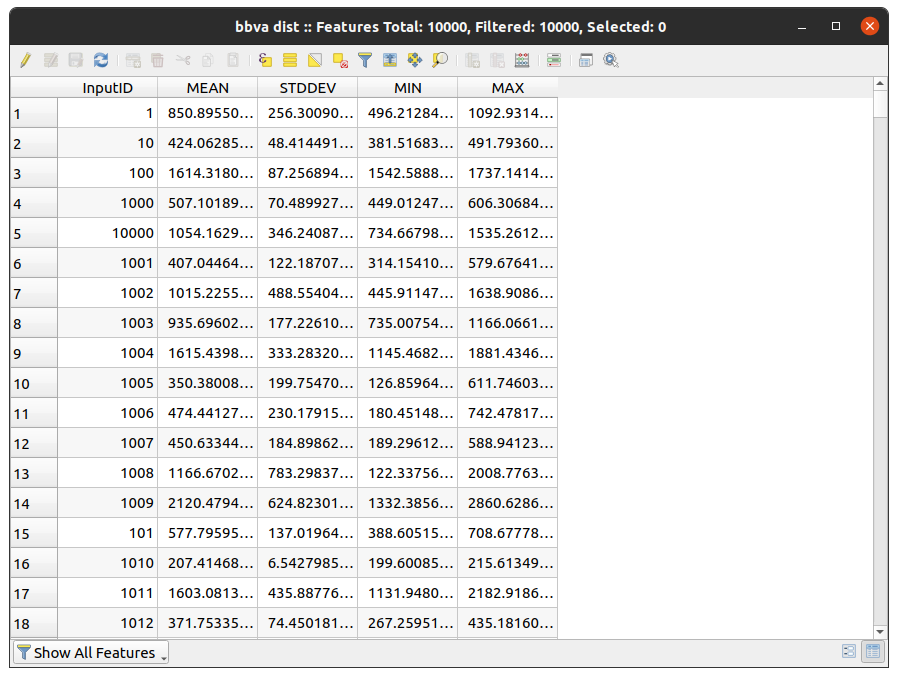
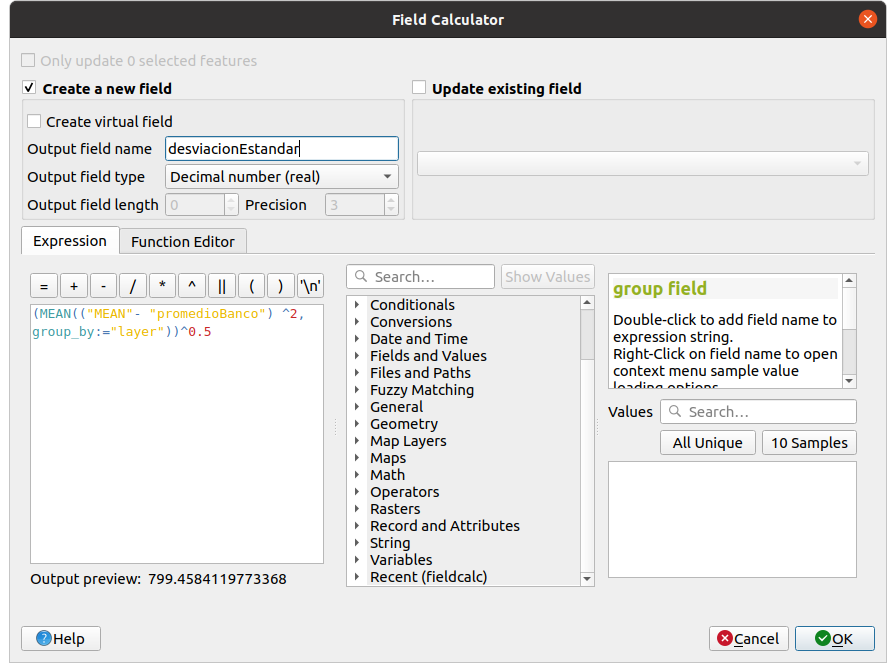
After we have created each of the layers, we can merge them using the same procedure that we implemented earlier. In this new layer we will add the mean value and the standard deviation of the mean distance (“MEAN” column) from each of the random points by grouping by each of the banks. To do this, we can click on the abacus that appears at the top and place the following formulas:
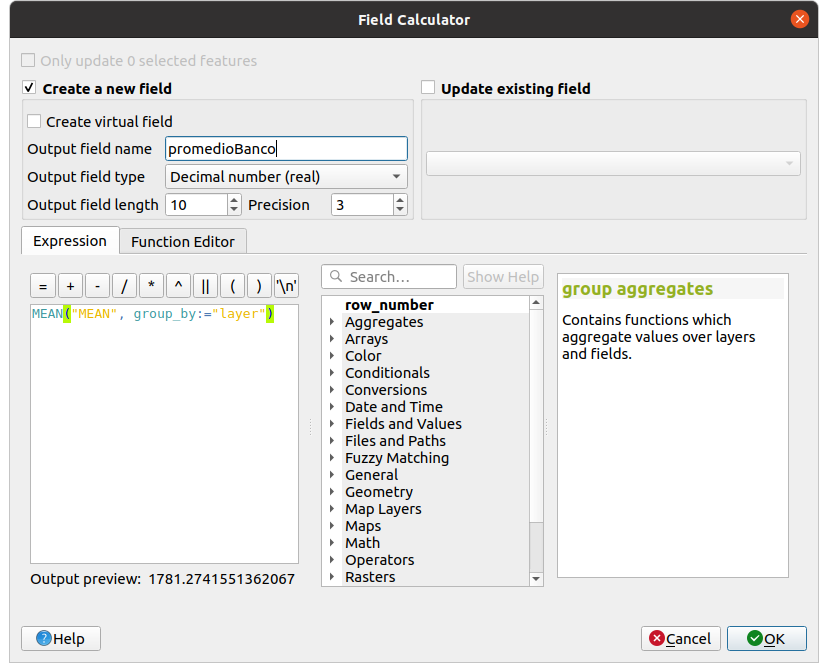
Now, by keeping one line per bank (we only need to filter by InputID equal to 1) and eliminating unnecessary columns, we can easily see the information that we were looking for:
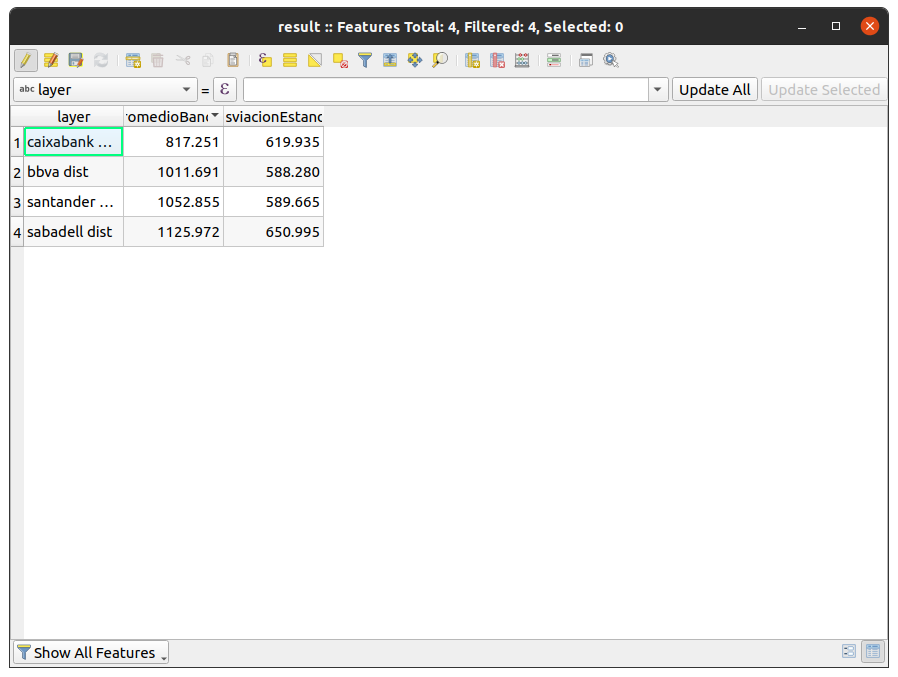
We see that, in general, the banks we analyzed have similar coverage and that, from a random point in the city, we can find a bank within an average distance of one kilometer.
For a complete list of all values that can be placed in the query visit this link.
That is the end of today’s post. If you have found it interesting, we encourage you to visit the Data Analytics category to see all the related posts and to share it in networks with your contacts. See you soon!
