Logistic regression is a statistical methodology that allows modeling the relationships between a binary categorical variable and a set of explanatory variables. Specifically, it models the probability that an observation belongs to one of the categories of that binary variable. In this post we will see the basic features of the model as well as its implementation in Python.
Categorical variables
A categorical or qualitative variable is a variable that indicates that the observation belongs to a group and therefore does not take numerical values. Examples of these are a person’s sex, nationality or whether a person is a smoker or not. If there are only two groups, the variable is called dichotomous or binary, while if there is more than one category, it is called polytomous.
Because the values of a qualitative variable are categories, the problem of predicting the value of a categorical variable is often referred to as classification, especially in the field of machine learning.
Sometimes numbers are assigned to each of the categories of a categorical variable. For example, a common practice is to code dichotomous variables by assigning one of the categories the number 1 and the other 0. This 0-1 coding also allows an interpretation in terms of probability since we can identify the assigned number as the probability that the observation belongs to a category.
The substitution of categories by numbers allows us to apply linear regression to model the probability of belonging to a category but this has several drawbacks:
- Several assumptions of linear regression are violated, making correct statistical inference impossible.
- The predicted values may fall outside the range of the variable. For example, values greater than 1 in a dichotomous variable coded with 0 and 1.
Logistic Regression
Logistic regression allows us to avoid the problems of linear regression. To see this, let’s consider the following problem. Suppose we have data about the passengers of the Titanic and we want to see which of their characteristics are related to the probability of survival. If we define ![]()
![]() as a variable that takes the value 1 if the person survived and 0 otherwise, we are interested in finding a function
as a variable that takes the value 1 if the person survived and 0 otherwise, we are interested in finding a function ![]() such that:
such that:

Where ![]()
![]() is a vector of passenger characteristics.
is a vector of passenger characteristics.
Linear regression would define

Where ![]()
![]() is a vector of parameters to be estimated together with parameter
is a vector of parameters to be estimated together with parameter ![]() . It is observed that for extreme values of
. It is observed that for extreme values of ![]() values above 1 or below 0 could be obtained.
values above 1 or below 0 could be obtained.
Logistic regression defines ![]()
![]() as the logistic function:
as the logistic function:

This function used in logistic regression has 2 interesting properties. The first is that its form solves the problem that predictions may lie outside the interval (0,1):
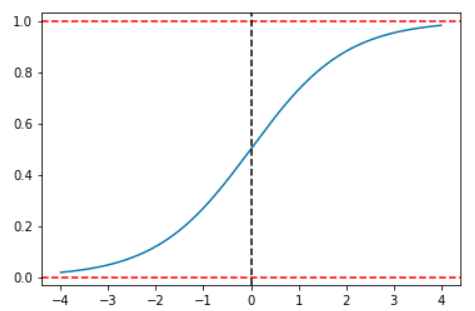
From this graph, as we can see, a change in ![]()
![]() depends not only on the change in the independent variable but also on the level of the dependent variable from which the change occurs. This makes an interpretation of the coefficients not possible beyond the sign of the coefficients. However, a little algebraic manipulation will allow us to establish an interpretation. Recall that in the case of a dichotomous variable there are only two possibilities so that
depends not only on the change in the independent variable but also on the level of the dependent variable from which the change occurs. This makes an interpretation of the coefficients not possible beyond the sign of the coefficients. However, a little algebraic manipulation will allow us to establish an interpretation. Recall that in the case of a dichotomous variable there are only two possibilities so that

If we calculate the ratio of the probabilities of the two categories we obtain:
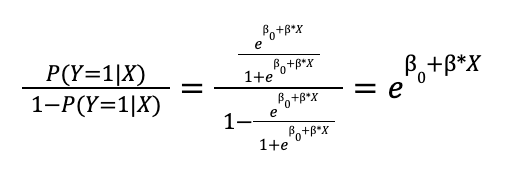
The fraction ![]()
![]() is called odds, a concept extracted from the world of betting and indicates how many times it is more likely to obtain an observation of category 1 with respect to category 0. Applying logarithm to both sides of this fraction we would be left:
is called odds, a concept extracted from the world of betting and indicates how many times it is more likely to obtain an observation of category 1 with respect to category 0. Applying logarithm to both sides of this fraction we would be left:

When using a logistic function, we establish a linear relationship with the logarithm of the odds and we can interpret the coefficients in the following way: for each one unit increase in ![]()
![]() the logarithm of the odds varies on average by
the logarithm of the odds varies on average by ![]() units, or, in other words, for each one unit increase in
units, or, in other words, for each one unit increase in ![]() the odds are multiplied on average by
the odds are multiplied on average by ![]() .
.
To estimate the parameters, a methodology called maximum likelihood estimation is usually used, which tries to find the values of the parameters that maximize the likelihood function for the sample of n observations:

Example of Linear Regression in Python
Data
To exemplify the use of logistic regression we will use one of the Kaggle datasets. To download them we can go here. In this dataset, each row represents a person who was on board the Titanic and each column is a characteristic of the passenger, including whether he survived the ship’s crash which will be the variable we will try to predict.
We can download two datasets, train.csv we will use to calculate our model while test.csv we will use to evaluate the performance of the model with unknown data for the model.
To train the model we are left with only the variables ‘Survived’, ‘Sex’, ‘Age’, ‘SibSp’, ‘Parch’, ‘Fare’ and ‘Embarked’:
columns_to_use = [i for i in train.columns if i not in
                  ["PassengerId", "Name", "Cabin", "Ticket", "Pclass"]]
The variable ‘Sex’ has some missing values so we will do a simple imputation using the set mean in order to use all the data. To facilitate this imputation we can use the SimpleImputer class of Scikit-learn:
#Imputing missing values in Age

imp = SimpleImputer()
imp.fit(train[["Age"]])
train.loc[:, "Age"] = imp.transform(train[["Age"]]).reshape((1,-1))[0]
The variable to predict ‘Survived’ is already coded with 0 assigned to those who did not survive and 1 to those who did. However, some of the variables are categorical and still have the labels, so we have to modify them so that we can use them in the regression. To do this, we will do a process called one hot encoding in which we generate as many variables as categories the variable has by placing 0 if the observation belongs to the category denoted in the new variable and 0 otherwise. Pandas allows us to do this in a simple way with the function get_dummies:
#Creating dummies

train_dummies = pd.get_dummies(train[columns_to_use], drop_first=True)

#Adding a constant to the data

train_dummies.loc[:, 'const'] = 1
The parameter drop_first=True allows us to eliminate the first category of each variable since it is not necessary in the regression as it can be represented as the base category, that is, the one obtained by default when all the other categories have a 0 assigned to them.
Python packages for Logistic Regression
There are several packages or libraries that implement logistic regression in Python. Two well-known ones are Statsmodels and Scikit-learn. In this post we will use Statsmodels because it has a simple way to obtain significance tests for the regression coefficients.
To train a logistic regression model with Statsmodels and get a summary of the results we use the following code:
model = sm.Logit(train.Survived,
                 train_dummies.loc[:, [i for i in train_dummies.columns
                                       if i not in ["Survived"]]])

result = model.fit()
result.summary()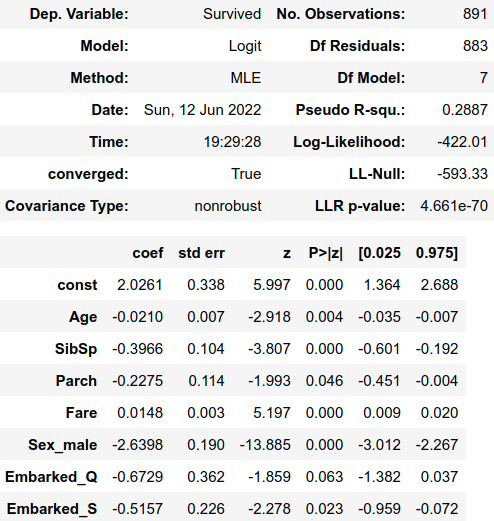
Evaluation of the results
In the “P>|z|” column of the summary we find p-values for the hypothesis that the coefficients are statistically different from zero. Looking at this column and using a threshold of 10% we can highlight several interesting details.
The first is that only the variable “Fare” has a positive and significant influence on the probability of survival. Specifically, leaving all other variables constant, an additional dollar spent by the passenger on his ticket causes the odds of surviving to not surviving to be multiplied by ![]()
![]() , which on average increases the odds of survival by 1.5%.
, which on average increases the odds of survival by 1.5%.
Younger people seem to have been luckier since the coefficient of “Age” has a negative and significant coefficient indicating that the probability of survival decreases with increasing age.
The number of relatives seems to have a negative influence on the probability of survival, as indicated by the negative coefficients of SibSp and Parch.
The variable “Sex_male” has a negative and non-zero coefficient, so belonging to the male group Sex_male=1 is related to a lower survival probability than that of the female group Sex_female=0.
Finally, passengers who embarked in Queenstown and Southampton on average appear to have lower survival probabilities when compared to those who embarked in Cherbourg as indicated by the negative and significant coefficients of Embarked_Q and Embarked_S.
Until now, regression has shown us the relationship between some variables and the probability of survival, but if we want to classify new observations we need to transform the probabilities into a category. What is usually done with predictions is to use a threshold, typically 0.5, and label as class 1 the observations with probabilities greater than this.
To make predictions with Statsmodels we can use the predict() property of a trained model to obtain the survival probabilities and apply a threshold to obtain the categories. Using sklearn we can understand how good our predictions are with the training data:
confusion_matrix(train_dummies.Survived, result.predict()>0.5)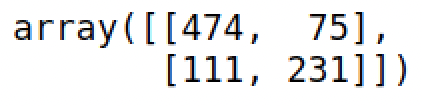
accuracy = accuracy_score(train_dummies.Survived,
                          result.predict() > 0.5)
accuracy = round(100*accuracy, 2)
print(f'Accuracy: {accuracy}%')
So our model manages to correctly classify 79.12% of the observations. For comparison we can estimate a linear regression model:
model_lin = sm.OLS(train.Survived,
                   train_dummies.loc[:, [i for i in
                                         train_dummies.columns
                                         if i not in ["Survived"]]])
result_lin = model_lin.fit()
accuracy = accuracy_score(train_dummies.Survived,
                          result_lin.predict() > 0.5)
accuracy = round(100*accuracy, 2)
print(f'Accuracy: {accuracy}%')
We obtain similar percentages with both models, but as shown in the following graph where each point is a passenger, we sometimes tend to predict probabilities outside the (0,1):
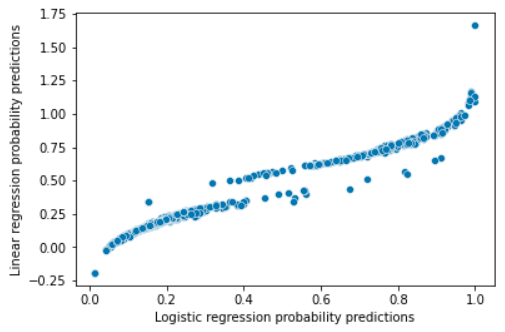
In addition, because some assumptions of linear regression such as normality of errors or homoscedasticity are violated, it is not correct to use confidence intervals or p-values to determine whether the relationships between variables are significant.
Conclusion
In this post we have introduced some basic concepts of logistic regression and the interpretation of its parameters. On the other hand, we have implemented this model in Python using Statsmodels and an example dataset, comparing its performance with that of linear regression.
This is all! If you found this post interesting, we encourage you to visit the Data Science category to see all the related posts and to share it on social networks. See you soon!
