In previous articles of our blog, we have reviewed the New features and improvements of DBT 1.9 and some of the key concepts of DBT: models, snapshots and materialisations.
On this occasion, we will see a practical example consisting of a functional test of how the semantic layer integrates with Google Sheets to be able to perform all kinds of queries on our metrics.
Marts layer
First, we will add some business logic to enrich the example. To do this, we will check the code in the github repository and copy the files corresponding to the business logic.
Next, we create a data layer called marts. In order to do this, we add a folder called marts inside models and copy the data from the marts layer.
- models/marts/fct_orders.sql: this table is of type ‘facts’. In it, we will find the orders with the information of each one of them, such as the day of the order, the customer or the total cost.
- models/marts/dim_customers.sql: this table identifies each customer and calculates their purchase history. It includes the date of their first and last order, the total number of orders placed and the total value spent. By combining this information, you get a complete picture of each customer’s purchase, even if they have not yet placed an order.
Metrics creation
We need to add the dbt_utils package as a dependency. In the root of the project we create a file called packages.yml.
packages:
- package: dbt-labs/dbt_utils
  version: 1.1.1
We copy the file inside metrics in the path models/metrics/metricflow_time_spine.sql, which is nothing more than a projection that has every day from 2000 to 2027.
We are now ready to start setting the components of the semantic layer. The first one we are going to define is fct_orders.yml and in this file we initialise the semantic model.
models/metrics/fct_orders.ymlsemantic_models:
- name: orders
defaults:
agg_time_dimension: order_date
description: |
Order fact table. This table’s grain is one row per order
model: ref('fct_orders')In this code snippet we are defining a semantic model called orders that structures and describes data specific to the order fact table fct_orders.
The model is based on fct_orders (referenced via ref(‘fct_orders’)). The default aggregation time dimension is order_date, that is, aggregations (sum, average, count, etc.) will use order_date as the time reference.
Recall what the fct_orders model looked like.

Let’s start defining the semantic layer starting with the entities, which we can easily recognise because they have their own identifier. We find order_id and customer_id, which we will add within the category entities.
The dimensions are those columns that help us to filter the data in a simpler way. In this case, it would be order_date, where we define a daily granularity.
Finally, we define the measures, which are the data that provide information through aggregations. In our case, we are going to define an order_total with an aggregation type sum and that will act on amount. (In the repository we will be able to find some more measures).
entities:
     - name: order_id
       type: primary
     - name: customer
       expr: customer_id
       type: foreign
   dimensions:
     - name: order_date
       type: time
       type_params:
         time_granularity: day
   measures:
     - name: order_total
       description: The total amount for each order including taxes.
       agg: sum
       expr: amount
The next step is to add the metrics block. This block represents exactly what the business needs. It is the definition of the metrics as the business will see them and, therefore, expressed in a language they can understand.
There are different types of metrics that we can configure:
- Conversion metrics: track base and conversion events within a period.
- Cumulative: accumulate a measurement over a period (requires a date model).
- Derived: perform calculations from other metrics.
- Simple: reference a measure without adding others.
- Ratio metrics: calculate the ratio between two metrics (numerator and denominator).
metrics:
 # Simple type metrics
 - name: "order_total"
   description: "Sum of orders value"
   type: simple
   label: "order_total"
   type_params:
     measure:
       name: order_total
 - name: "order_count"
   description: "number of orders"
   type: simple
   label: "order_count"
   type_params:
     measure:
       name: order_count
 - name: large_orders
   description: "Count of orders with order total over 20."
   type: simple
   label: "Large Orders"
   type_params:
     measure:
       name: order_count
   filter: |
     {{ Metric('order_total', group_by=['order_id']) }} >=  20
 # Ratio type metric
 - name: "avg_order_value"
   label: "avg_order_value"
   description: "average value of each order"
   type: ratio
   type_params:
     numerator: order_total
     denominator: order_count
Here we can see the definition of some metrics. In the original file, fct_orders.yml, we will find more definitions. At this point, we already have our semantic layer defined, with the metrics that business has asked for. The next step will be to provide business with simple tools to query all this information.
Configuration of the DBT Semantic Layer
To be able to execute and configure the semantic layer, we will need to create an Environment and a Job with an execution in that job. In the left side menu, accessing to Deploy, we will find the two sections to create them.
The environment can be created as Staging by selecting the Snowflake connection. We would already have everything we need for this process.
The job, on the other hand, does not need any special configuration. We create it on our environment and the command to execute can be the default one, dbt build.
Finally, clicking on Account Settings and in our project, we will see a section to configure the Semantic Layer. Inside, we will have to fill in the data for the integration of the DBT Semantic Layer. In this process, credentials will be generated and linked to the integration we are configuring. Do not lose the token generated in this step because we will use it later.
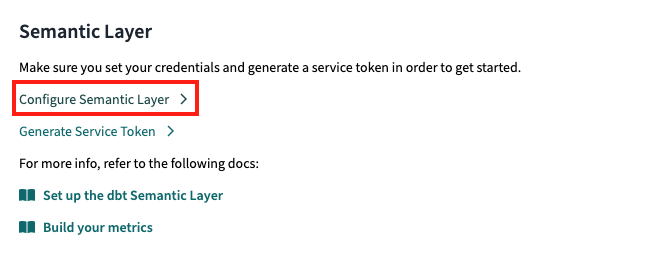
Requests and integration with the Semantic Layer
If you have been able to get this far, you have already managed to set up a whole project from scratch with the DBT Semantic Layer. Now it’s time for exploitation.
In the DBT Cloud documentation you can find the different integrations available for this feature. Let’s use Google Sheets to finish our case study.
We open a new Google Sheets document and install the add-on dbt Semantic Layer for Sheets.
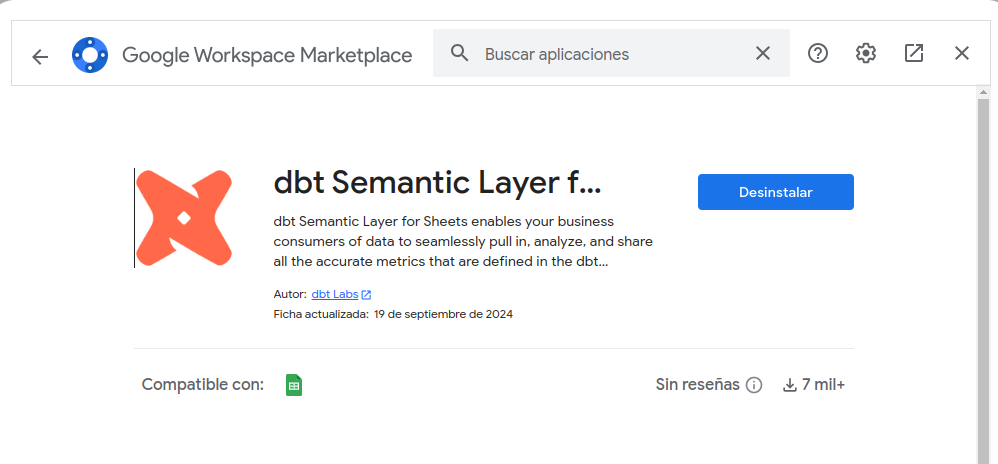
In the extensions menu the installed add-on will appear and we will be able to open it.
It will ask us for the host, the environment ID and the Service Token that we have previously generated. In our project, in Account Settings, we will find the necessary data.
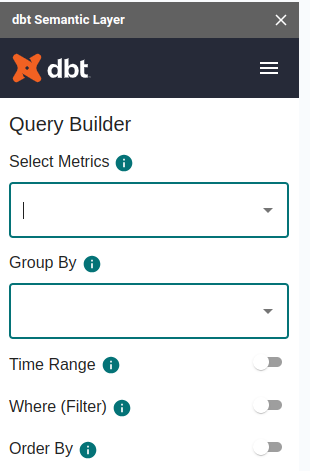
Once configured, the following window will appear that allows us to make queries directly on the metrics established in our organisation.
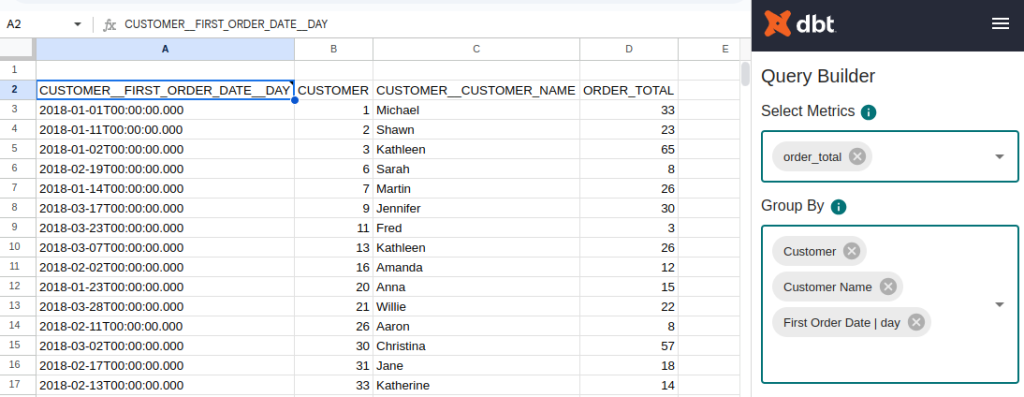
If we deploy the metrics, we will see that all those that we have established in DBT Cloud are defined. In addition, we can group them by the entities and dimensions that we have defined in our project.
This layer is very convenient to use for more administrative and non-technical profiles, as they will always work on generic metrics calculated for the whole organisation.
Conclusion
In this post, we have developed a case study of the DBT Semantic Layer from scratch. In addition, we have been able to see the ability of DBT to generate new unified metrics under this approach. Finally, we have integrated DBT metrics and API with Google Sheets, allowing to explore in a practical way and without technical knowledge the data managed by the appropriate team.
We hope you found the content of this post useful. We recommend you to visit the Data Engineering category to see more articles like this one and we encourage you to share it with your contacts so they can also read it and give their opinion. See you in networks!

