In this post, we will talk about the main concepts of DataHub at a functional level and we will study the fundamental elements by taking a tour of the application. To be able to follow it, you can use the DataHub demo page.
In the top bar of the home screen of the demo, or of our own deployment, we can find the following sections.

By clicking on Govern we can find both Glossary and Domains. These are two main concepts of DataHub.
What is a Domain in DataHub
A domain, in a nutshell, is a logical grouping of different resources within our platform. It can belong to another parent domain, so we can use this concept to completely model the hierarchy of spaces within our organisation.
Creating a domain is a task that can be done very easily, we only need to have Manage Domains privileges.
Once we are ready to create a domain, we see that the creation options are very brief, practically a name and a parent on which to place it. When we go inside, we see that we have more options, as we must not forget that a domain is designed to be able to relate resources under the same context.

It is also possible to add resources to the domain by clicking on the Add Assets button, where a list of all the resources will appear so that they can be linked to the domain.
On the other hand, you can add documentation to your domain from the Documentation tab. The documentation that should be placed here, from my point of view, must always be related to the data, it would not be convenient to include general documentation of the domain, as this platform is not suitable for it.
From a more practical point of view, we will think of a domain as the conceptual space that encompasses all these related resources. In our organisation, we may decide to manage data across sites because each site is very independent of the others, and therefore define each site as a separate domain.
The Glossary concept in DataHub
Talking about a Data Governance platform means talking about a complete glossary of terms and DataHub will be no exception. In fact, this concept is one of the main pieces of the platform.
First of all, and for the newcomers: What is a term? What is a group of terms? And what is a glossary? The definition of each of these concepts is very simple and intuitive, but here the most complicated part, without a doubt, is the practical application.
A glossary is a collection of terms and groups of terms. Together they form the glossary. A term is a clear and concise definition of a concept within our organisation. This seems so simple, but sometimes it is not, especially when we are dealing with what is known as ubiquitous language in reference to the Hexagonal Architecture. Martin Fowler, a software developer, delves into the concept of ubiquitous language in this lecture.
So let’s land with a practical example of what a term is. First, is everything in our company a term in our glossary? The answer is a resounding NO. We have to understand that we are on a Data Governance platform and therefore the terms must deal with data management.
Let’s say our organisation is in logistics and works with packages. We are building the data ecosystem of our organisation and, within the business layer, the word ‘piece’ is used a lot. A ‘piece’ can be a term to use within our data glossary, as we will see, for example, delivery routes and number of pieces delivered. This is a very important and powerful concept, because it is the one that will later allow us to build a very rich data ecosystem.
Now, let’s suppose that we want to see a dashboard through Looker showing the pieces distributed throughout the city. That dashboard, which will be fed through a table in our Data Warehouse, will have to be represented in our platform and tagged with one or more terms. Most likely, we will apply the term ‘piece’ as a label. Terms can be applied to different data resources. For example, we might tag the term ‘pieces’ to a column that carries the aggregation of packages delivered per day.
Once created, we can generate documentation associated with that term or link a web page to it.
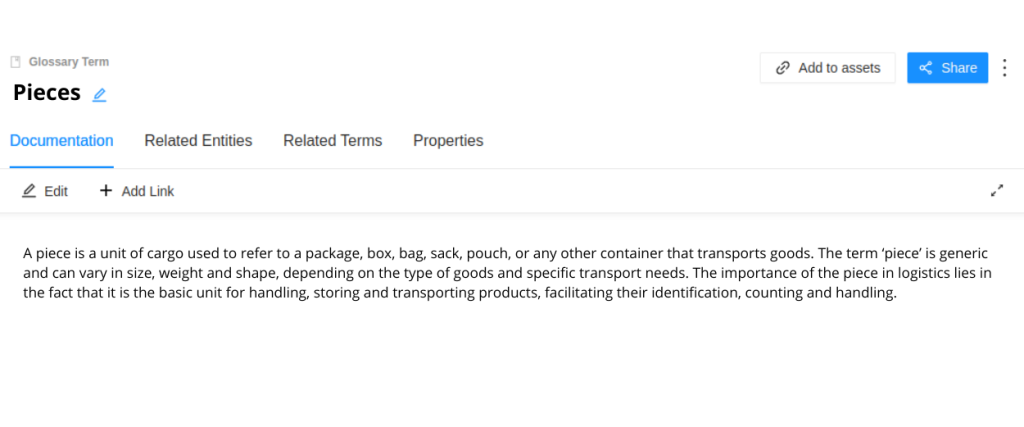
The second tab allows us to manage the resources related to the term. When we want to relate a new resource, we must click on the Add to Assets button, where a modal will appear that will allow us to filter and search for our resource.
Finally, and for me the most relevant part of term management, is that a term can be related to another term. DataHub allows us to establish two types of relationships: Contains and Inherits. This is especially useful to be able to enrich our data ecosystem.
Going back to our example, let’s suppose we want to see those bundles that have been lost in the organisation. We can define the term ‘lost’, with its appropriate definition, and relate it to ‘piece’ in order to have the representation of a bundle that has been lost. It is still a piece, but it is a higher specification than just a piece.
Data source ingestion
When we talk about data ingestion, we refer to the process of gathering, importing and processing data from various external sources to store, analyze and use them within the platform. This process is what gives meaning to the whole platform, since, thanks to it, we will be able to have different data sources updated and ready for analytical use, represented within DataHub.
DataHub is not only oriented to the ingestion of a database or a Data Warehouse. The platform provides mechanisms to ingest other types of data, such as transformation processes like those that occur in an ELT, data visualisation processes from a BI dashboard, or data quality and validation processes.
The easiest way to ingest new data is through the platform’s web interface.
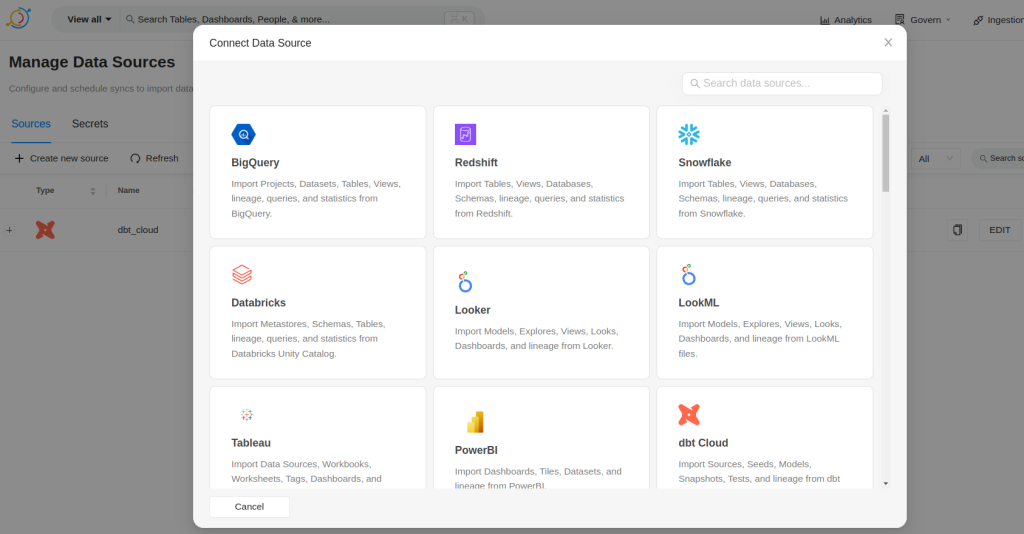
There, we will be able to find the supported connectors. These connectors work with a pooling system that will consult the source about the metadata it contains and refresh the information within DataHub. This type of integrations is known as Pull integrations. But they are not the only ones that exist, we can also find the so-called Push integrations, such as Airflow or Spark.
Basically, in Push integrations, it is the sources themselves that issue the changes directly on the platform, without the platform being the one to consult. This usually happens when there is no clear API or robust query schema for DataHub to work on.
To understand integration as a source, we will focus on Pull types.
In our example, we have integrated a dbt cloud account.

We can see how a CRON type column appears with the configuration of when the synchronization with the source should be executed. We can also observe how the last execution has gone to detect if there has been a failure in the integration.
Data Assets and Entities in DataHub
Finally, we will see the resources ingested in the previous phase. In DataHub, all data objects are related in one way or another to other data objects. Here we can see a representation of these relationships.

To open the data explorer click on Explore all in the home screen. And the following screen will open.
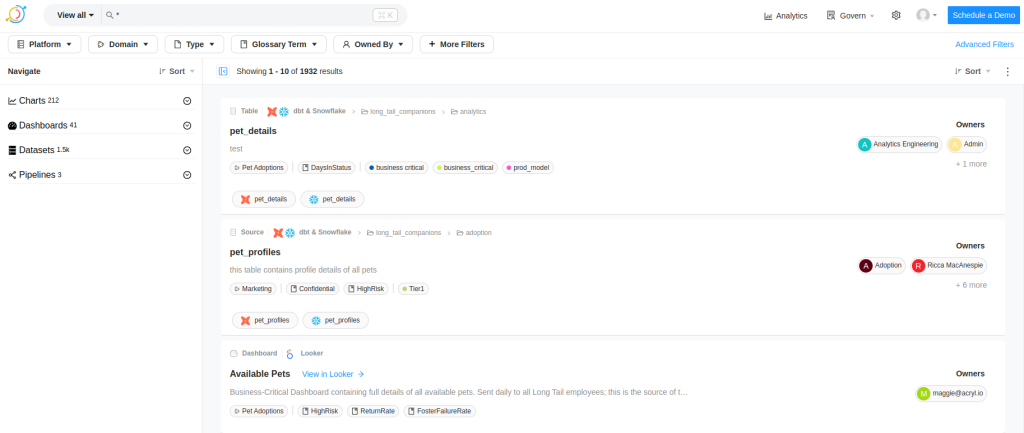
This screen is key to navigate through any type of data within the platform. In the top bar, we find the filtering bar, while the left sidebar allows us to navigate through the grouping of the filtered data. In the central part, we have the list of resources in detail.
Each of the items in the central part shows a summary of the resource. Let’s click on the next resource.

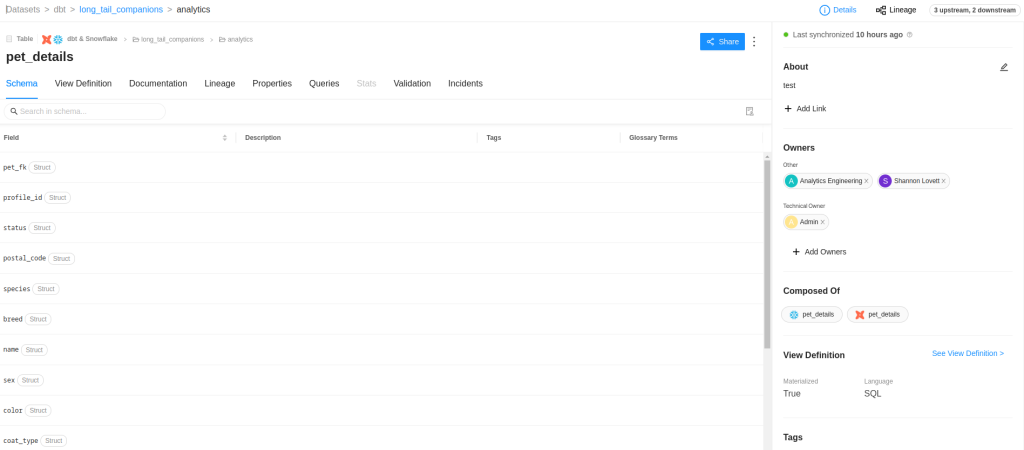
Let’s look at the detail screen. In this case, it is a Snowflake table called pet_details, which is modeled using dbt. We will see the definition of the fields in the table and, if we had descriptions for each column, all this information would be integrated with DataHub.
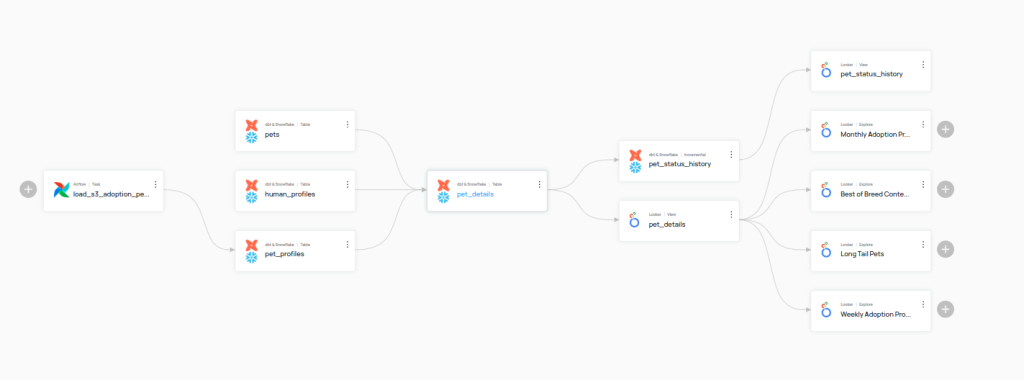
It is interesting to click on Lineage to see the relationship of this resource with other resources. This screen is key to know the origin of each of these resources and how they can be exploited.
If the model contains any constraints that must be met when loading, we can see them in the validations tab. This tab helps us to keep track of the data quality. In this case, with the integration with dbt cloud, DataHub is able to collect the JSON generated as a result of the data and present the latest test runs of the model.
The last tab we found is related to cooperation and communication between users. If a user encountered an issue, he/she could report it within the model to inform the data team. This capability is integrated with ticketing systems such as Jira, so that even if the issues are created using the DataHub system, the team will still be able to work with its task management platform.
Conclusion
That’s all for this tutorial, I recommend reviewing the different ingest integrations that DataHub has and, if any particular one is of interest, I recommend reading the DataHub documentation because we will find specific functionalities between each one.
If you found this article interesting, visit the Data Engineering category of our blog to see posts similar to this one and share it with all your contacts. Don’t forget to mention us to let us know what you think @Damavisstudio, see you soon!

