The duo of Prometheus and Grafana is widely used in modern architectures due to the great interplay between the two tools. On the one hand, Prometheus is responsible for collecting and storing metrics in the form of time-series and then managing them. On the other hand, Grafana offers the possibility of visualising this data through a powerful UI.
In this article, we will see how to deploy a Grafana environment with Prometheus with a Linux exporter node, a most useful and usual combination of this architecture.
Use case: Prometheus, Grafana and Linux exporter
Next, we will develop a use case and monitoring of a Linux node that could be extrapolated to different exporters and applications. In this example, we are using docker-compose so that you can replicate it on your machine and explore the alternatives of configuring Grafana with Prometheus.
Basic configuration
First of all, we need to set up a file system with the following form and hierarchy:
├── docker-compose.yml
├── grafana
│  └── datasources
│      └── datasources.yml
└── prometheus
    ├── data
    └── prometheus.yml
The path ‘prometheus/data’ will be used as a persistence point for the data generated by Prometheus. Therefore, the permissions that this folder will have must grant the docker user the possibility to work properly. The way to solve this will depend on each user and its policy and management of permissions and users. However, there is the possibility of giving open permissions to this folder since we are in proof of concept mode.
Next, we show the docker-compose.yaml that will have the following structure:
version: '3.8'

services:
  prometheus:
    image: prom/prometheus:latest
    container_name: prometheus
    volumes:
      - ./prometheus/data:/prometheus/data
      - ./prometheus/prometheus.yml:/etc/prometheus/prometheus.yml
    ports:
      - "9090:9090"
    command:
      - "--config.file=/etc/prometheus/prometheus.yml"
    networks:
      - monitoring

  grafana:
    image: grafana/grafana:latest
    container_name: grafana
    volumes:
      - ./grafana/datasources:/etc/grafana/provisioning/datasources
    ports:
      - "3000:3000"
    depends_on:
      - prometheus
    networks:
      - monitoring

  node-exporter:
    image: prom/node-exporter:latest
    container_name: node-exporter
    ports:
      - "9100:9100"
    networks:
      - monitoring

networks:
  monitoring:
    driver: bridge
This docker-compose will deploy three Docker containers, Prometheus, Grafana and the Linux Exporter. The form of connectivity between Prometheus and the Node to be observed will be through the configuration of the ‘prometheus.yml’ file.
global:
  scrape_interval: 15s

scrape_configs:
  - job_name: 'node_exporter'
    static_configs:
      - targets: ['node-exporter:9100']
Finally, Grafana will need to be configured via the ‘datasources.yaml’ file to indicate connectivity to Prometheus via port 9090. This driver uses the PromQL system to launch queries against Prometheus and return results and time series.
apiVersion: 1
datasources:
  - name: Prometheus
    type: prometheus
    access: proxy
    url: http://prometheus:9090
    isDefault: true
At this point, we already have the basic configuration to connect the three components.
Advanced configuration options
Now, in such an environment, we can take into account that it is possible to manage all the internal configuration through the jsonData field within the DataSource definition. Let’s take a look at a more advanced configuration to see what kind of interesting options we can find:
apiVersion: 1
datasources:
  - name: Prometheus
    type: prometheus
    access: proxy
    url: http://prometheus:9090
    isDefault: true
    jsonData:
      httpMethod: POST
      manageAlerts: true
      prometheusType: Prometheus
      cacheLevel: 'High'
Important configuration fields:
- httpMethod. Parameter that allows configuring how the queries to Prometheus will be made, since it accepts both GET and POST requests. In advanced configurations, the use of the POST method allows data to be sent in the body of the request.
- manageAlerts. Determines whether Grafana will manage alerts based on the alert configuration set in Prometheus.
- prometheusType. Allows to establish the type of Prometheus distribution with which Grafana will be integrated.
- cacheLevel. Allows the results of queries to Prometheus to be stored for a longer period of time.
Scalability of Prometheus with Thanos
In environments where there is a high volume of metrics coming from all the applications and systems of the organisation, Prometheus can experience performance problems. In which scenarios do these problems arise? They occur in Prometheus configurations that have multiple instances, are deployed in different regions or in a cluster, and have challenges managing data replication or long-term retention of massive data. Prometheus alone is not designed to solve these challenges.
Thanos solves different issues, all of them oriented to scalability. Being open source, it allows the capabilities of Prometheus to be extended, bringing high availability to the project and greater scalability.
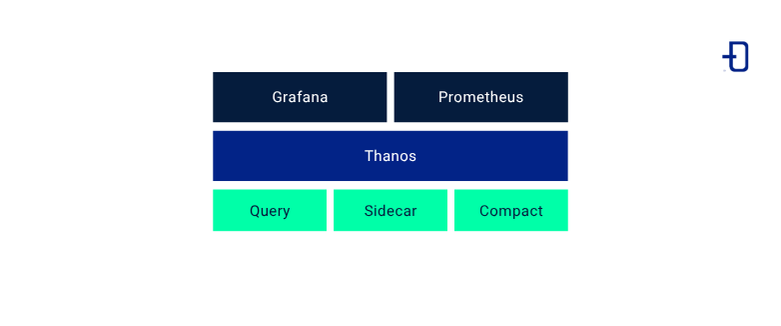
Essential components of Thanos
Thanos incorporates a component called Thanos Sidecar. This element allows the storage of time series that Prometheus would normally store locally to be hosted externally in the cloud in AWS S3 or Google Cloud Storage. This approach is perfect for storing metrics that are no longer consulted as often, but that you don’t want to lose.
Regarding high availability, Thanos allows running Prometheus instances in parallel, replicating metrics data across different geographies. Thanos Query makes it possible to perform federated queries on the instances, ensuring that metrics data can always be accessed, even if an instance is unavailable.
Thanos Compact takes care of compressing data to improve storage efficiency, a very useful component in the case of long-term storage.
In the deployment process, we need to configure both the Thanos Sidecar component and Thanos Query. When Grafana tries to connect, we must change the configuration to point to the Thanos Query port, as it will handle all requests against Prometheus.
Conclusion
Prometheus relies on Grafana to cover very important aspects of data visualisation that it cannot address on its own. The Grafana stack is fully adapted to integrate with Prometheus, which makes configuration very easy. However, we have seen that there are certain limitations in this architecture and how in productive environments with large volumes of data, the use of Thanos can make up for these shortcomings in terms of scalability and high availability.
So much for today’s post. If you found it interesting, we encourage you to visit the Software category to see similar articles and to share it in networks with your contacts. See you soon!
