Looker Studio is a visualizer and a data management platform which allows extracting information while maintaining its governance, security, accessibility and agility in use. The main advantage of its use lies in the fact that it has a fast, simple and intuitive learning process. In addition, it is capable of generating internal queries of our data as a result of several clicks.
It is important to note that Looker Studio connects with several different data sources. For example, spreadsheets, databases, data warehouses and Google Cloud. Through these connections, it is able to generate queries on the data and extract results that are not stored in the tool itself. Thus, the information extracted from these queries is always kept up to date.
From the point of view of an organization, it is extremely practical to opt for its use. Integrating Looker Studio facilitates strategic decision-making based on data analysis and interpretation. This involves following a Data Driven approach.
Looker Studio encourages companies to be autonomous when building their own reporting strategies. The implementation of Data Visualization services such as those developed by Damavis provide them with a tool with which to understand the business at a glance.
Other advantage is the fact that it does not require programmatic knowledge, as we have already mentioned. In addition, it supports the possibility of automating the extraction of reports as PDF files with the frequency we need.
Looker Studio Pro
The paid option of Looker Studio provides numerous functionalities. These features are designed to apply a more robust security layer for our organization’s data. This requirement is met by assigning the resources to the organization level instead of to the user who created it. In the same way as in the free version. Thus, if the corporate account of the user who owns the resource is deleted, the resource itself will not disappear.
Another important feature is the possibility of assigning administration, content management or collaboration roles to users. These roles will go hand in hand with a set of permissions for data accessibility and manipulation. With this new strategy, group workspaces emerge, where each team will only have access to the resources it needs to work on.
The price for using these functionalities is $9 per month for each user accessing the project.
First steps with Looker Studio
Data sources
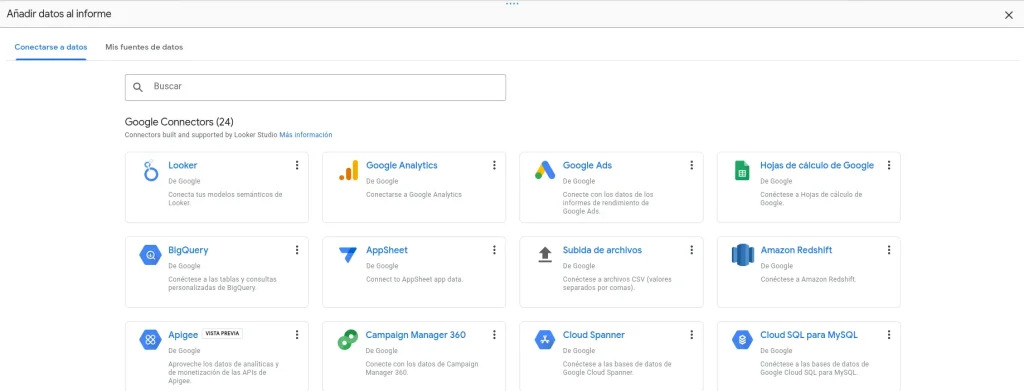
When we access Looker and create a new report, the tool shows us a set of connectors available to indicate the origin of our data. To continue, we must choose one or more of the connectors that appear in the list. That is where the data for the visualizations will be extracted from. Now it is time to choose the data to be used in the Report. For example, an external table or a data file stored elsewhere.
Charts and design
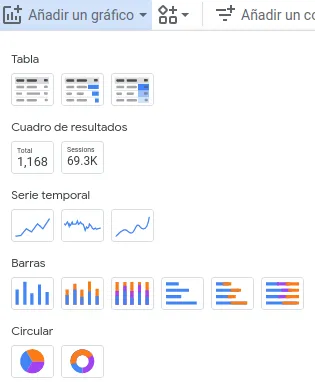
Once this is done, you can start doing analysis using the graphs provided by the tool, which can be configured using the different columns provided by the data you have previously imported. It is important to know how to choose which visualization to use for each type of data in order to extract useful information for the use case. Otherwise, we would generate analyses that do not provide us with value.
Other important aspect provided by this tool is the ability to generate reports with a corporate look and feel. This can be done thanks to the fact that the tool allows the introduction of customizable elements, such as images, colors, shapes and any other element that allows the identification of a brand. In addition, control panels can be introduced to filter the data.
As you can see, the styling of both the controls and the other visual elements of the report can be changed to make it aesthetically pleasing to the environment in which it will be used.
Calculated data
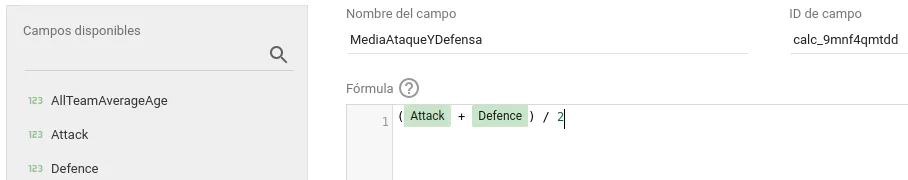
On the other hand, although it was mentioned that no programming knowledge is required, in case it is necessary, Looker Studio has an internal language to perform different operations. This can be used to generate calculated columns from the originally imported data and to insert them into the report visualizations and analysis.
This language has a number of functions available to perform more complicated calculations when necessary. The list of functions of this language can be found in the official documentation.
Merged data
Another interesting functionality is the ability to join data from different tables that could be in different data sources. These are called JOINS and can be of different types.

This concludes this small introduction to what could be a regular flow with the Looker Studio tool. This is not a complete guide, but a contact shot.
Why use Looker Studio?
In summary, Looker Studio is a tool with a very accessible learning curve. However, this does not mean it lacks power when it comes to processing data or creating visually appealing reports for a company. Looker Studio offers multiple functionalities for free to generate our reports.
Regarding the Pro version, it can be considered in the case of a report that requires separating work teams through roles and permissions or that the organization itself is the owner of the resource.
Conclusion
Both the free version of Looker and Looker Studio Pro offer a wide range of possibilities for integrating data sources into a platform where they can be analyzed and presented through dynamic and interactive reports. In this post, we have been able to see a comparison between these two options and learn more in detail what features can be found in each of them.
If you found this article interesting, we encourage you to visit the Software category of our blog to see posts similar to this one and to share it on social networks with all your contacts. Don’t forget to mention us to let us know your opinion @Damavisstudio, see you soon!
