
Apache Spark is a tool that we have already discussed in different articles of our blog. At Damavis, in addition to using it in many of our projects, we consider Spark to be the Swiss army knife when it comes to data processing. However, we must clarify that it is not a perfect or easy to use technology.
Like any productive system, Spark needs detailed monitoring processes to ensure its stability and to understand what is happening. In this space, we will explore how, thanks to Prometheus, we can improve the observability of the jobs launched in Spark as well as analyse the metrics in real time.
If you haven’t worked with Prometheus yet, I recommend you take a look at the post Monitoring with Prometheus and Grafana to get to know the tool. It will be very useful to understand the basic concepts that will be used in what we will see next.
Monitoring metrics with Spark
Apache Spark offers several alternatives for monitoring and observability of both the system and the running processes. Natively, in the Spark UI you can consult basic information about the execution of jobs, the status or logs of these executions, etc. The API is also available to launch specific queries about the status of a task within Spark. This is very useful when integrating observability systems.
On this occasion, we will only deal with the integration of Prometheus with Spark.
Spark integration with Prometheus
Most systems that integrate with Prometheus reserve a dedicated space for HTTP queries called /metrics. However, despite its ability to deploy an API capable of querying status and usage statistics, Spark uses the Prometheus JMX Exporter system.
This agent is coupled to Spark processes and is responsible for transforming JMX metrics into a format that Prometheus can understand. In this way, the JMX Exporter exposes a default http endpoint, /metrics, which Prometheus will query to collect the metrics.
JMX Exporter
The specific configuration we need to launch when running our Spark with the JMX Exporter integration capability would be:
--conf "spark.driver.extraJavaOptions=-javaagent:/path-to-jmx_prometheus_javaagent.jar=7071:/path-to-driver-config.yml"
--conf "spark.executor.extraJavaOptions=-javaagent:/path-to-jmx_prometheus_javaagent.jar=7072:/path-to-executor-config.yml"
In this way, we establish that the agent that is in charge of raising an endpoint in the configured port (by default 7071 for drivers and 7072 for executors), will be able to consult the metrics of the same in Prometheus format.
Thus, Spark will not be able to natively retrieve a /metrics, but does it through the integration with JMX Exporter.
To understand what happens underneath, it is necessary to know in detail what the JMX Exporter is and what it is responsible for. This component is responsible for extracting the metrics exposed by a Java application through the JMX.
Basically, JMX stands for Java Management Extension, a technology within the Java framework for managing and monitoring Java applications. Typically, it is used to expose metrics, configurations and other information about the operations that Java is performing. This allows the status of the application to be monitored in real time.
Without going too much deeper into JMX, the information regarding the metrics to be exported is configured and predefined natively by the Spark developers. They themselves are responsible for registering a series of MBeans (components that are in charge of exposing metrics) with data such as performance, job status, resource usage, etc.
JMX Exporter is configured via a yaml file, which will select and transform the MBeans into metrics that Prometheus can understand.
Example of Spark integration with Prometheus
The resources we will need to carry out this integration are the following:
- Apache Spark
- JMX Exporter. This is a .jar file that can be downloaded from this Git repository, specifically, the javaagent.
- Prometheus. In previous posts we already learned how to launch it. In this case, we will use Docker.
- Python and PySpark.
PySpark application
For this example, we will use a very simple PySpark code that will allow us to observe how the metrics are exported:
from pyspark.sql import SparkSession
import time

if __name__ == "__main__":
    spark = SparkSession.builder.appName("PrometheusMonitoringExample").getOrCreate()

    df = spark.range(1000)
    df = df.withColumn("square", df["id"] * df["id"])
    df.show()

    time.sleep(60)
    spark.stop()
This application simply creates a DataFrame and keeps the application running for 60 seconds in order to monitor it.
Configuring JMX Exporter
When configuring the JMX Exporter, we need to pass it a yaml file like this one:
startDelaySeconds: 0
lowercaseOutputName: true
lowercaseOutputLabelNames: true
rules:
  - pattern: ".*"
With this configuration, we tell it to expose all detected metrics and to normalise the names with lower case letters. However, this file allows us to fine-tune what and how we want it to expose.
Running Spark
In this case, we will run spark-submit on our Python code. However, it should be noted that there are alternatives for configuring JMX on a Spark cluster.
spark-submit --conf "spark.driver.extraJavaOptions=-javaagent:/home/oscar/spark-prometheus/jmx_prometheus_javaagent-1.1.0.jar=7071:/home/oscar/spark-prometheus/spark-jmx-exporter.yaml" /home/oscar/spark-prometheus/app.pyPrometheus configuration
We are entering the final stretch of this step-by-step tutorial. Now, all that remains is the configuration of Prometheus which, in this case, is very simple.
global:
  scrape_interval: 5s

scrape_configs:
  - job_name: 'spark'
    static_configs:
      - targets: ['localhost:7071']
Once configured, we only need to run Prometheus either locally or in Docker. If you do it with Docker, keep in mind that you have to use the root user and give permissions to the folder where you have the yaml. You should also change the gateway so that it can access the host PC’s ports.
So far, we already have Spark integrated with Prometheus. If we consult localhost:7071/metrics, we will find the variables that are being exported.
For example, we can see the heap memory usage with the following query:
jvm_memory_used_bytes{area="heap"}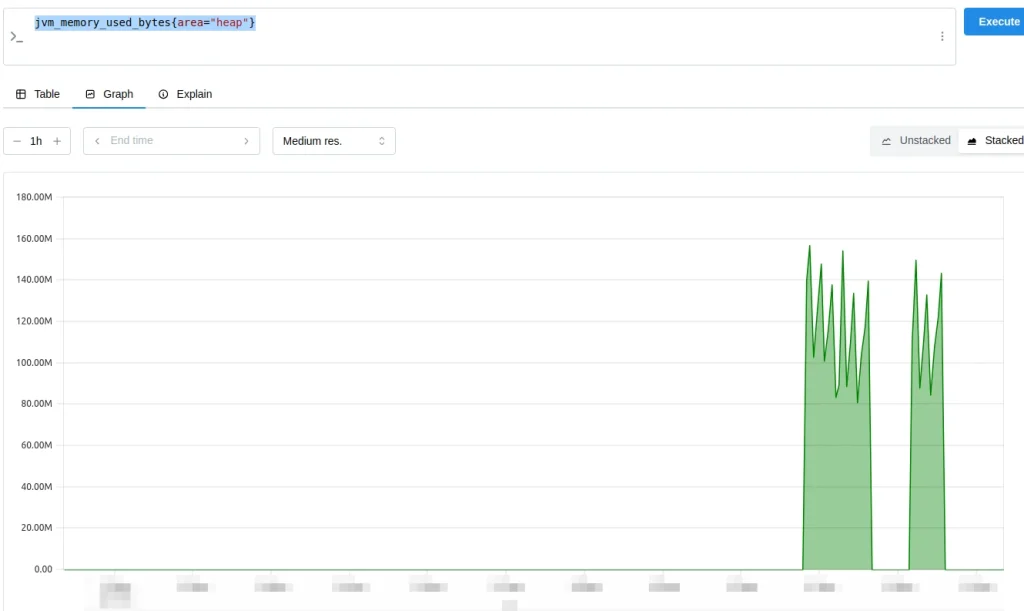
Next, we will see a list of useful metrics along with their queries:
jvm_memory_used_bytes{area=“heap"}. Shows the used bytes of the JVM.jvm_memory_pool_used_bytes{pool="G1 Old Gen"}. Shows how many bytes are being used in the G1 Old Gen memory pool.jvm_classes_currently_loaded. Indicates how many classes are being loaded into the JVM, giving an idea of the size of the execution.jvm_compilation_time_seconds_total. Total time the JVM has spent compiling.jvm_gc_collection_seconds_sum{gc="G1 Young Generation"}. This is the cumulative Garbage Collection (GC) time in G1 Young Generation.jvm_gc_collection_seconds_count{gc="G1 Young Generation"}. Displays the number of Garbage Collection cycles in G1 Young Generation.process_cpu_seconds_total. Indicates the CPU usage of the processjvm_threads_current. Represents the current number of threads in the JVM.
Conclusion
In this post, we have discussed the integration of Spark and Prometheus integration as well as what JMX Exporter is and how to integrate it with Spark to expose the /metrics endpoint. Finally, we have done a practical example of running a PySpark application and looked at some metrics within Prometheus.
So much for today’s post. If you found it interesting, we encourage you to visit the Software category to see similar articles and to share it in networks with your contacts. See you soon!
